


 56 / 104

56
Uzman Gözüyle ·
Expert View
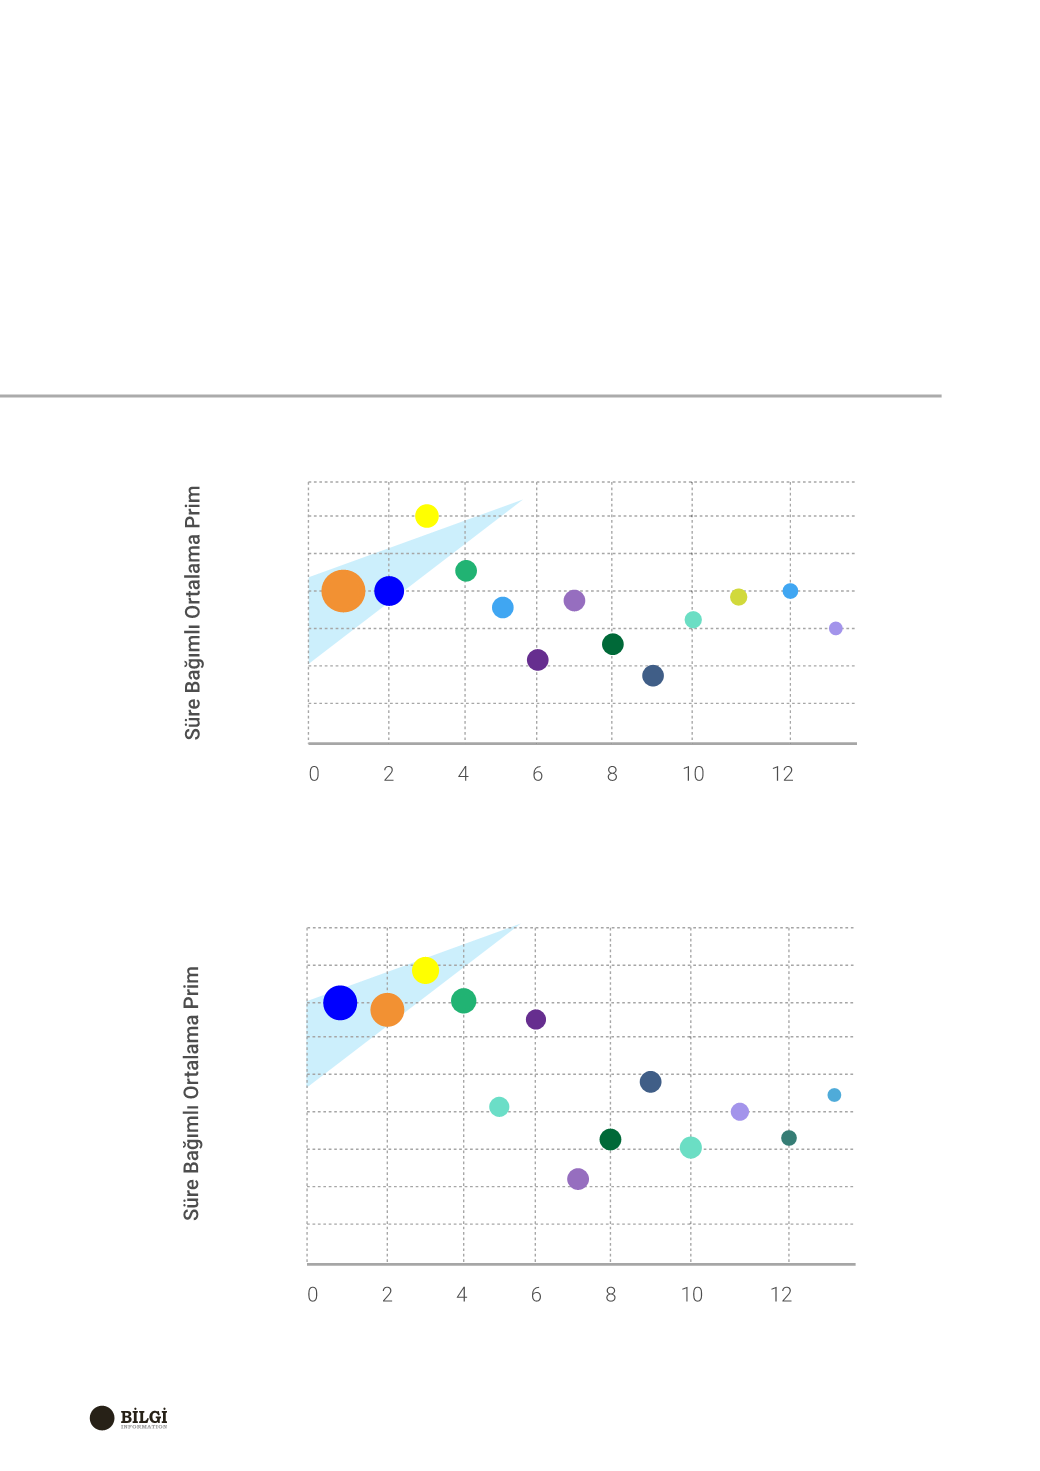
Aşağıdaki grafiklerle fiyat odaklılığı test edelim.
Grafiklerde sol eksen ortalama primi göstermekte,
baloncuklar soldan sağa doğru Trafik Poliçe adedi
büyülüğüne göre şirketleri ifade etmektedir.
Let’s test if the customers are price-focused with
the bubble charts below. The left axis of the charts,
shows the average premium, and the bubbles
represent the companies sorted descendingly
according to the number of written MTPL Policies
from left to right.
2014
50
Time Dependent Average Premium
100
150
200
250
300
350
400
2015
50
Time Dependent Average Premium
100
150
200
250
300
350
400
450
500
Grafik 2 – Trafik Ürünü Otomobil Araç Grubu Ortalama Yazılan (Süre Bağımlı) Primin Pazar Payı ile İlişkisi
Graph 2 – The Relationship Between the AverageWritten Premium in Liability Insurance Automobile Category
(Time Dependent) and Market Share