


 53 / 76

53
Predictive Modelleme
Yukarıda da bahsedildiği üzere çalışmanın ilk aşamasında
sigorta şirketlerinden bugüne kadar fraud şüphesi ile
inceledikleri claim’ler ve bunlara ait sonuçlar istenmiş ve 22
şirketten yaklaşık 43 bin claim için geri dönüş yapılmıştır.
Toplanan bu veri hem iş kurallarının ağırlıklandırılması ile
exper model skorlamasında kullanılmış hem de eğitim verisi
olarak kullanılmak üzere predictive modelleme çalışmasına da
baz teşkil etmiştir.
Predictive modelleme, bir olay/olgu’nun mantıksal olarak
ilişkili olabileceği düşünülen (hipotetik model) değişkenler
ile açıklanmaya çalışılarak bu değişkenlere göre pattern
farklılıklarının belirlenmesi ve formüle edilmesidir. Bu projede
tahminlenmek istenen, bir claim’in fraud olma eğilimidir. Bu
eğilimi açıklamak üzere kullanılan potansiyel değişkenler iş
kurallarının geliştirilmesi sırasında oluşturulan veri seti iken
öğrenme verisi (fraud olma/olmama) şirketlerden elde edilen
fraud inceleme dosyalarıdır. Modelleme çalışması SAS E-Miner
data mining tool’u kullanılarak gerçekleştirilmiştir.
Predictive modelleme için oluşturulan öğrenme datası
bivariete analiz ile incelenerek hangi değişkenlerin fraud
(olup/olmama) ile anlamlı bir ilişkisi olduğu belirlenmiştir.
Belirlenen bu değişkenler kullanılarak yapılan her bir model,
ilk olarak modelde bulunan değişkenler ile fraud arasında-
ki ilişkinin mantıksal olup olmadığı ardından lift, kümülatif
response, ROC curve eğrileri incelenerek de modelin ro-
bust (güvenilir, tutarlı) ve tahmin gücü değerlendirilmiştir.
Yapılan denemeler sonucunda 6 değişkenli %20’lik dilimde
lift 1.35 ve kümülatif response rate i %28 olan model nihai
model olarak seçilmiştir.
Prediktive modelin de tamamlanması ile bir claim için hem
“expert model skoru” hem de fraud eğilim skorunu göster-
en “predictive skor” üretilmiştir. Bu iki skorun exper mod-
el yönünde ağırlıklandırılması ile her bir claim için “Claim
risk skoru” hesaplanmıştır. Claim risk skoru 0-1 aralığında
değer almaktadır.
Predictive Modeling
As mentioned above, insurance companies were asked to
send the suspicious claims they have been investigating and
a total of 43 claims were received from 22 companies. The
data collected was used both in scoring of the expert model
by developing weights for the business rules and served as a
basis for the predictive modeling phase where it was used as
training data.
Predictive modeling is the process whereby an event/
phenomenon is explained by the variables which are
considered to be related to it (hypothetical model) and
pattern variations are determined and formulated based on
these variables. In this project what is being estimated is the
inclination of the fraud to happen. The potential variables
used to explain this trend are the data set created during the
development phase of the business rules and the learning
data (fraud/not fraud) are the fraud investigation files received
from the companies. Modeling was carried out using SAS
E-Miner data mining tool.
Learningdata developed for predictivemodelingwas analyzed
using bivariate analysis and variables with significant
relationship with fraud (fraud or not) were determined. For
every model developed using these variables the following
analyses were made: analysis to determine weather or not
the relationship between the variables in the model and the
fraud are logical, analysis to determine cumulative response,
analysis of ROC curves to determine weather or not the model
is robust and the estimation effectiveness of the model. As a
result of the tests, the model with 6 variables that had a 1.35
lift and response rate of 28% in the 20% segment was chosen
as the final model.
After the completion of the predictive model, a “predictive
score” that indicates both the “expert model score” and the
fraud trend score for a claim was generated. With weighting
of these two scores in the expert model direction, a “Claim
risk score” was calculated for every claim. Claim risk score
ranges between 0 to 1.
UZMAN GÖZÜYLE
EXPERT VIEW
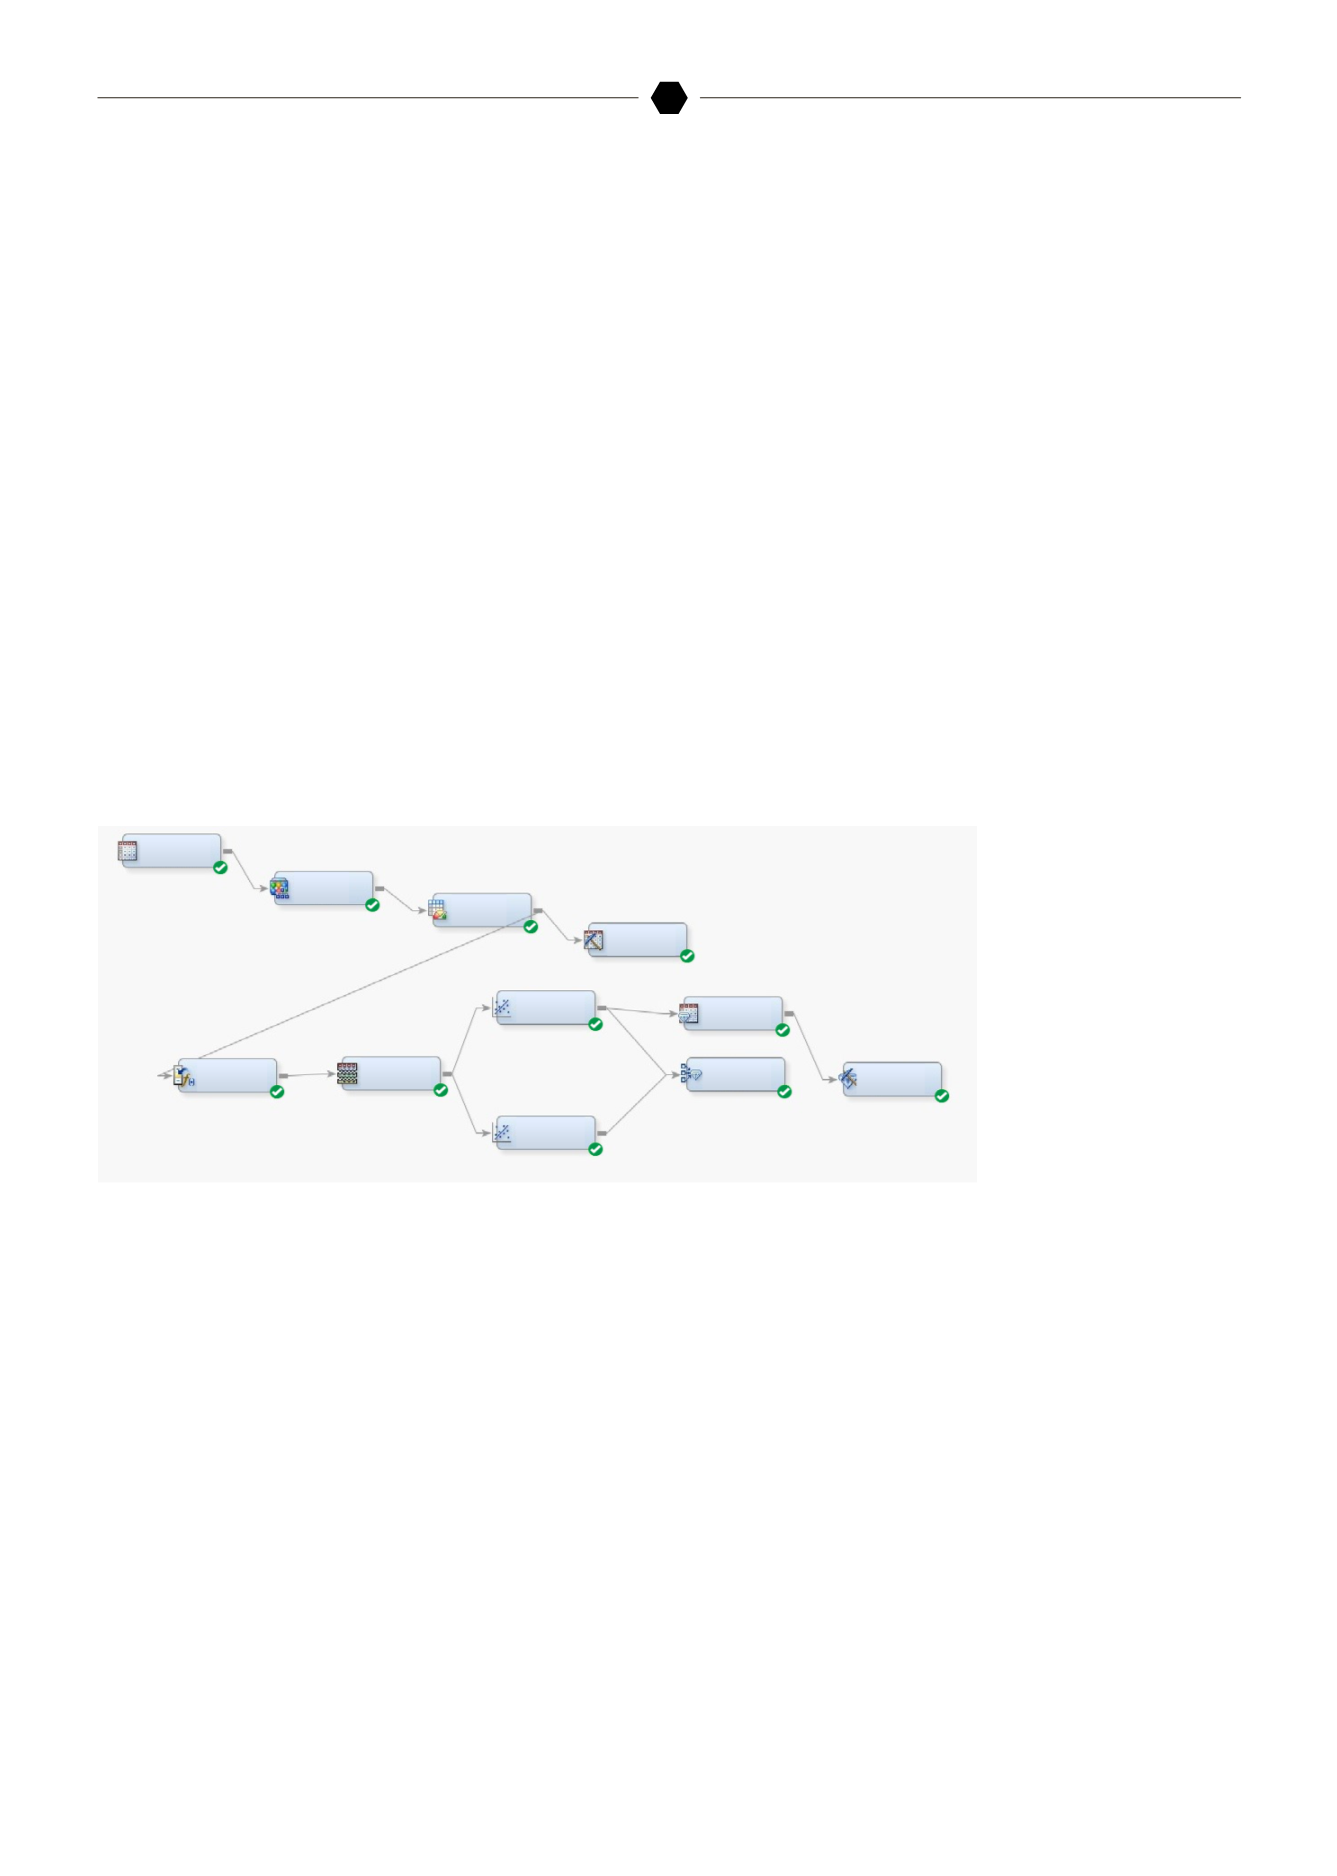
Şekil (figure) 3:
Prediktif Modelleme
Akış Diagramı
/
Predictive Modeling Flow
Chart
MODEL_CLAIM_
VARS1
Interactive
Grouping
Scorecard
DMDB
FinalModel_V2
Score
Score Code
Export
Model
Comparison
FinalModel
Data Partition
Impute