


 82 / 92

80
RAPOR
REPORT
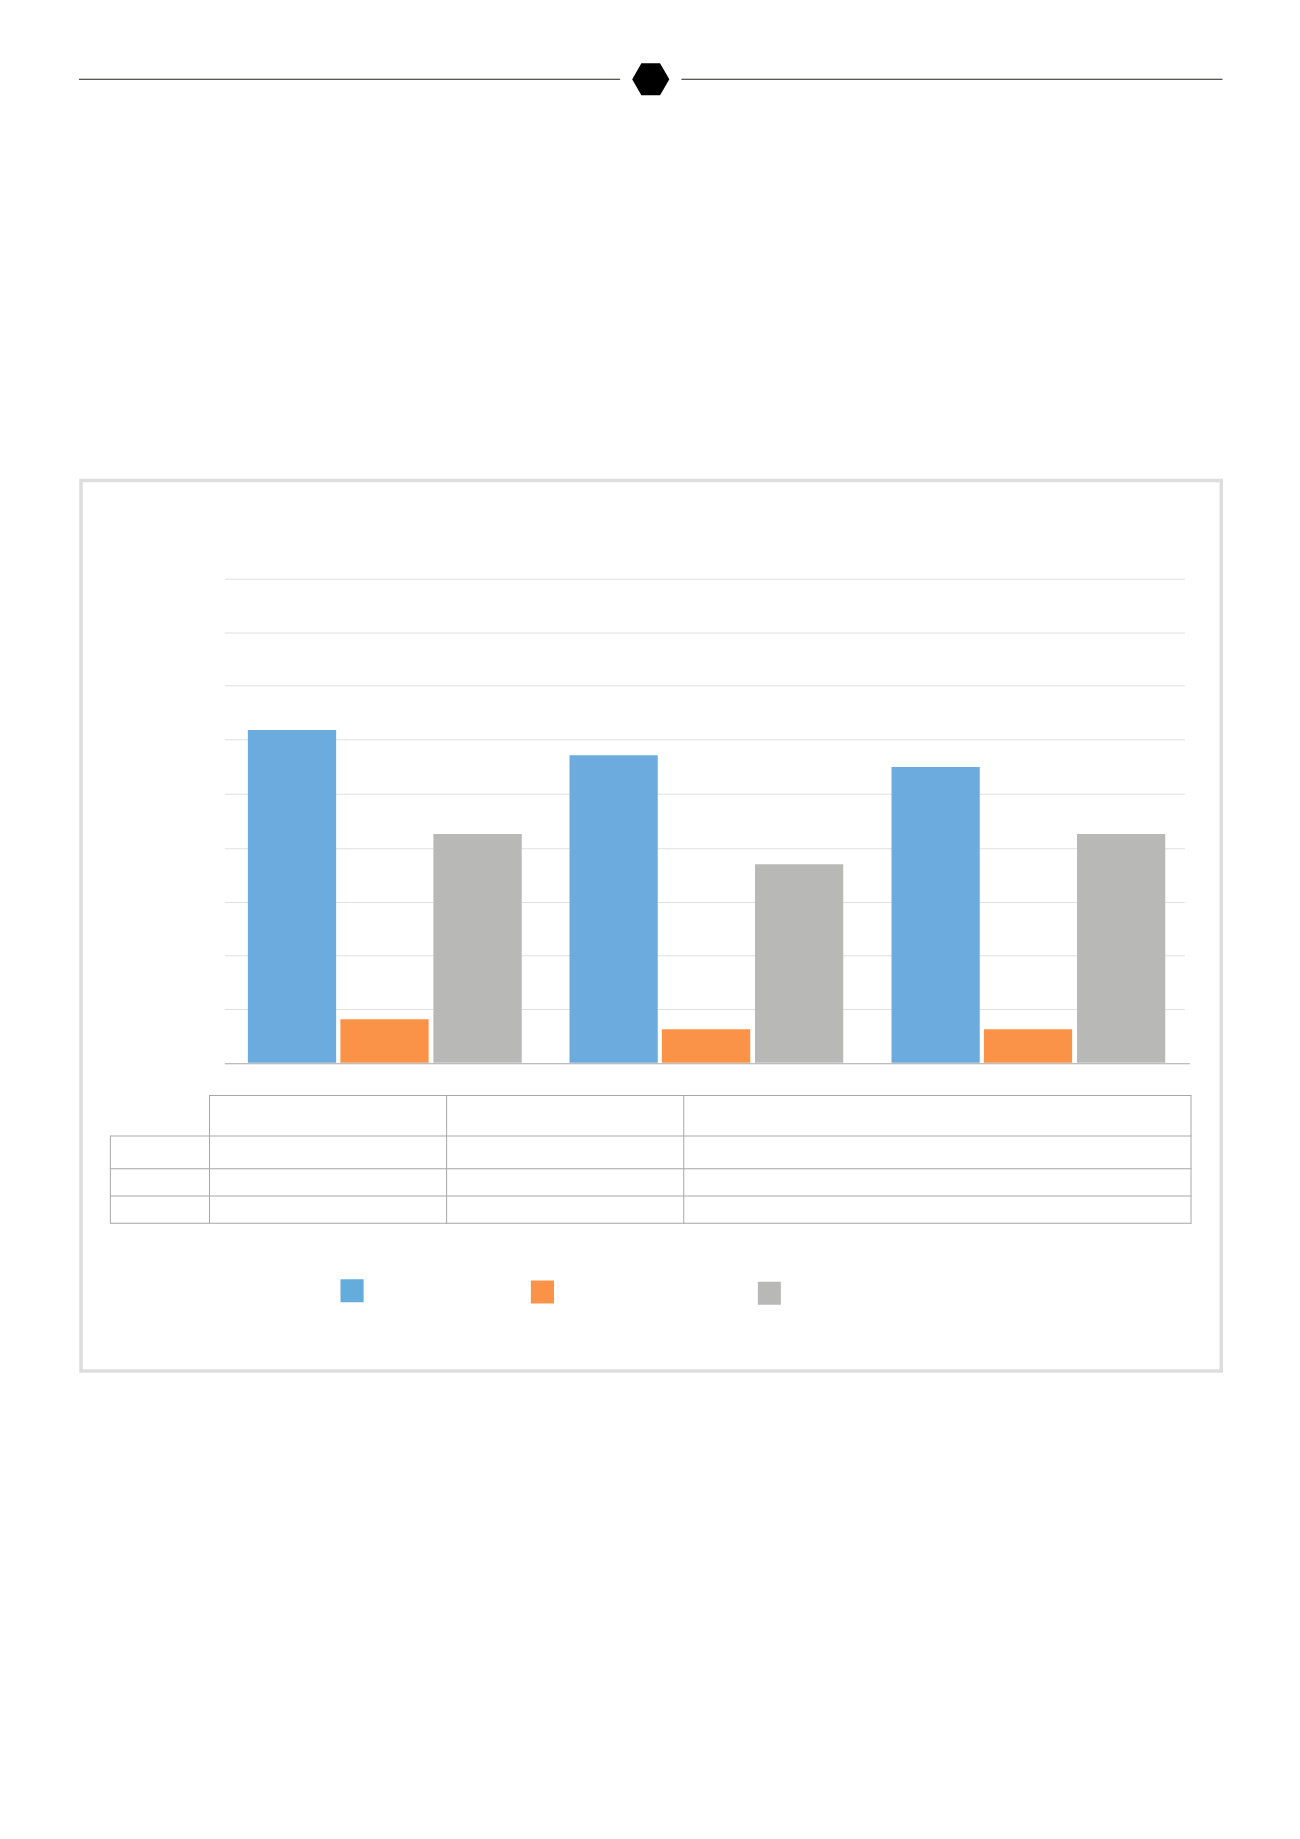
In this regard, the service selections and part preference for
policies created during the period of December 2015 and
January-February-March 2016 were shown in the graph below:
In case a repair is to be made when the risk is realized, the
number of repairs made at repair services selected by the
beneficiaries is higher than the number of repairs made at
repair services selected by the beneficiaries. However the number
of not indicated is the highest.
Bu kapsamda 2015 Aralık ve 2016 yılının ilk çeyreğinde
düzenlenen poliçelerde servis seçim tipi ve parça tercihleri
aşağıdaki gibi oluşturulmuştur.
Riziko gerçekleştiğinde onarım yapılacak olması halinde,
sigortalı tarafından belirlenen servislerde yapılan onarım,
şirket tarafından belirlenen servislerde yapılana göre çok
daha fazladır. Ancak belirtilmemiş olan adet çoğunluktadır.
450000
400000
350000
300000
250000
200000
150000
100000
50000
0
Ocak 16
January ’16
Şubat ’16
February ’16
Mart ’16
March ’16
Belirtilmemiş
317,468
289,749
272,357
Sigorta Şirketi
39,703
34,041
32,586
Sigortalı
214,568
182,572
227,620
Servis Seçim Tipi /
Service Selection Type
Belirtilmemiş
Not Indicated
Sigorta Şirketi
Insurance Company
Sigorta Şirketi
Insured
Hasar tazmin edilirken kullanılan orijinal parça veya eşdeğer
parça seçeneklerinden hangisinin ne kadar kullanıldığına
dair verilere baktığımızda, orjinal olan parça miktarı diğer-
lerine göre daha fazladır.
An overview of the figures showing the amount of original
parts and equivalent parts used during claim compensation
process demonstrate that the amount of original parts used is
higher than other type of parts used.