


 45 / 60

45
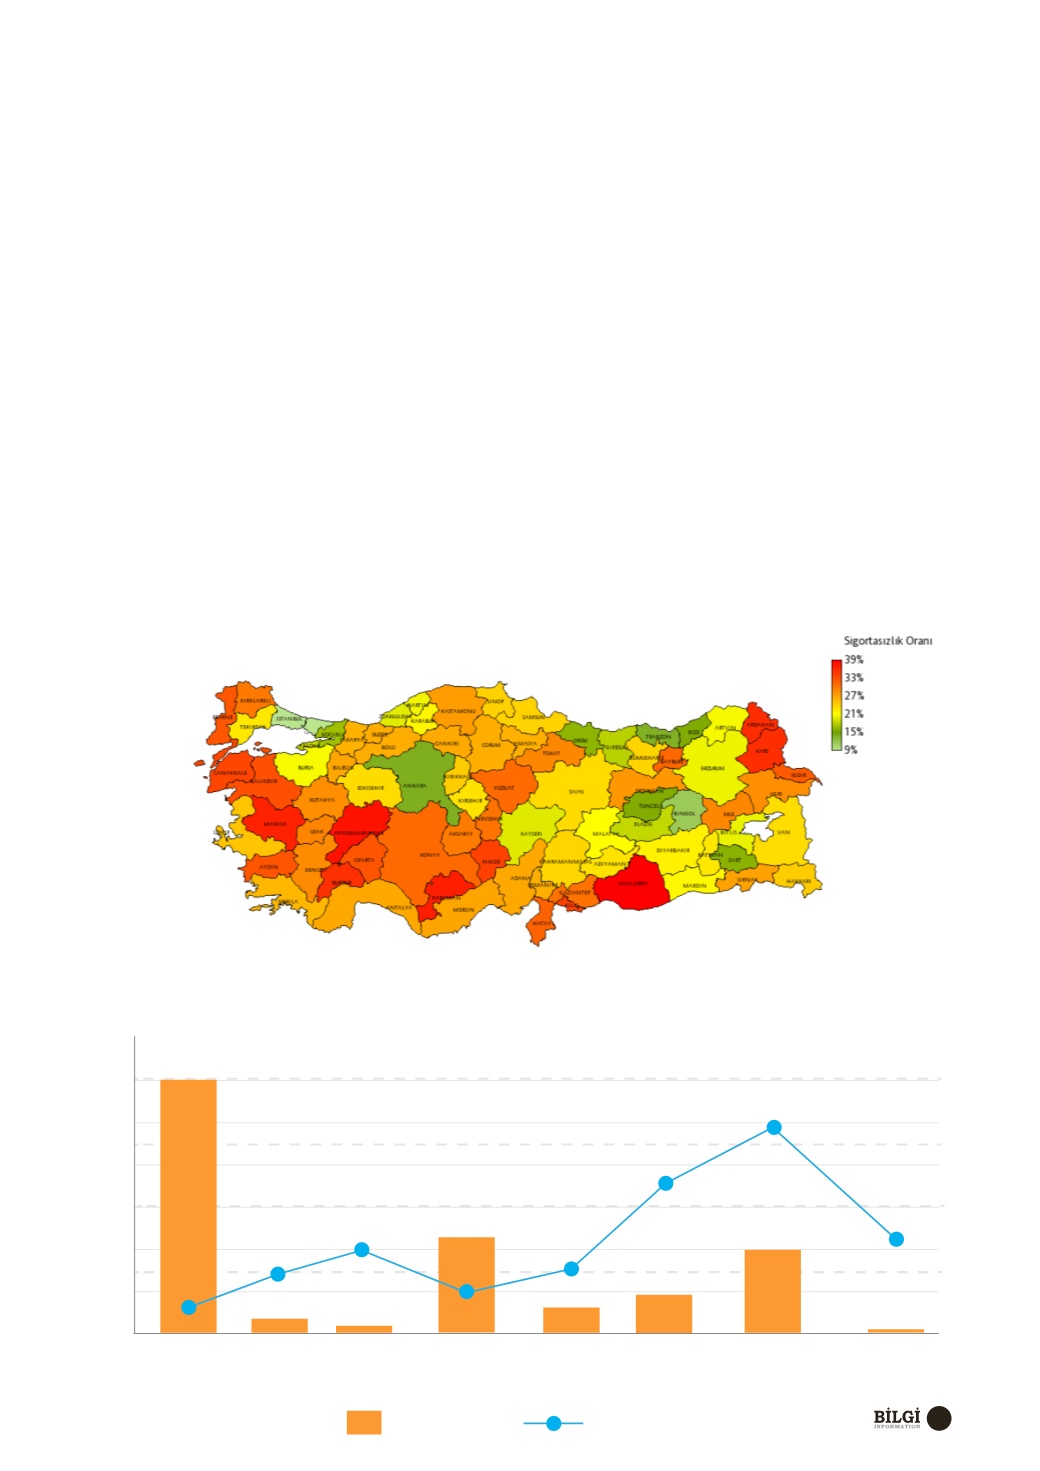
ARAÇ TÜRÜ BAZINDA SİGORTASIZLIK ORANI DAĞILIMI (TÜM TÜRKİYE)
DISTRIBUTION OF NON-INSURANCE ON THE BASIS OF VEHICLE CATEGORIES (ALL TURKEY)
OTOMOBİL
CAR
0
0%
SİGORTASIZLIK ORANI
UNINSURED RATE
TRAFİK SİGORTASI
TRAFFIC INSURANCE
2017 Eylül ayı itibariyle sistemimizde yürürlükte
bulunan Trafik Sigorta poliçeleri ve yine TUİK
tarafından 2017 Eylül ayındaki TUİK araç adedine
göre hazırlanan sigortasızlık verilerine göre,
sigortasızlık oranı en yüksek iller % 22,40 oranı
ile Şırnak, % 18.94 ile Afyon ve % 18.29 ile Yozgat
olarak dikkat çekmektedir. Sigortalılığın en yüksek
olduğu iller ise % 94.80 oranı ile Tunceli, % 94.74 ile
İstanbul ve % 93.67 ile Bingöl olmuştur.
Araç grubu bazında sigortasızlık oranları
incelendiğinde ise en düşük sigortasızlık oranı %
9.89 ile Otomobil grubunda gerçekleşirken, en
yüksek sigortasızlık % 66.25 ile Motosiklet ve Yük
Motosikleti grubunda ortaya çıkmaktadır.
According to the Traffic Insurance Policies
registered in our system by September 2017, and
also basing on the non-insured vehicle figures
of TUİK (Turkey Statistics Organization) for
September 2017, the provinces with highest number
of uninsured vehicles are Şırnak with 22,40%, Afyon
with 18,97% and Yozgat with a ratio of insured
vehicles 18,29%.
The provinces with highest insured vehicle figures
are Tunceli with 94,80%, İstanbul with 94,7% and
Bingöl with a ratio of insured vehicles as 93,67%.
When the non-insurance rates per vehicle groups
are examined; it may be seen that the lowest rate
of uninsured vehicles is spotted in automobiles
group with 9,89%whereas the highest figure of
uninsured vehicles can be seen in Motorbikes and
Load Transport Bikes group with 66,25%.
MİNİBÜS
MINIBUS
OTOBÜS
BUS
KAMYONET
TRUCK
SİGORTASIZLIK ORANI
UNINSURED RATE
TUİK ARAÇ ADET
UNINSURED RATE
KAMYON
LORRY
TRAKTÖR
TRACTOR
MOTOSİKLET VE YÜK
MOTORBIKES AND
FREIGHT
ÖZEL AMAÇLI TAŞIT
SPECIAL PURPOSE
VEHICLE
2.000.000
20%
4.000.000
6.000.000
40%
8.000.000
10.000.000
12.000.000
80%
60%
9.89 %
20.88 %
27.09%
13.47%
21.81%
47.38%
66.25%
28.89%
Report
· Rapor