


 31 / 78

31
Modelleme sonrası, Trafik ve Kasko ürünlerinde Alanları
ve Problemleri belirleyerek veri kalitesi ölçümleri için veri
setleri oluşturmaya başladık. Bu çalışmaların izlenmesi
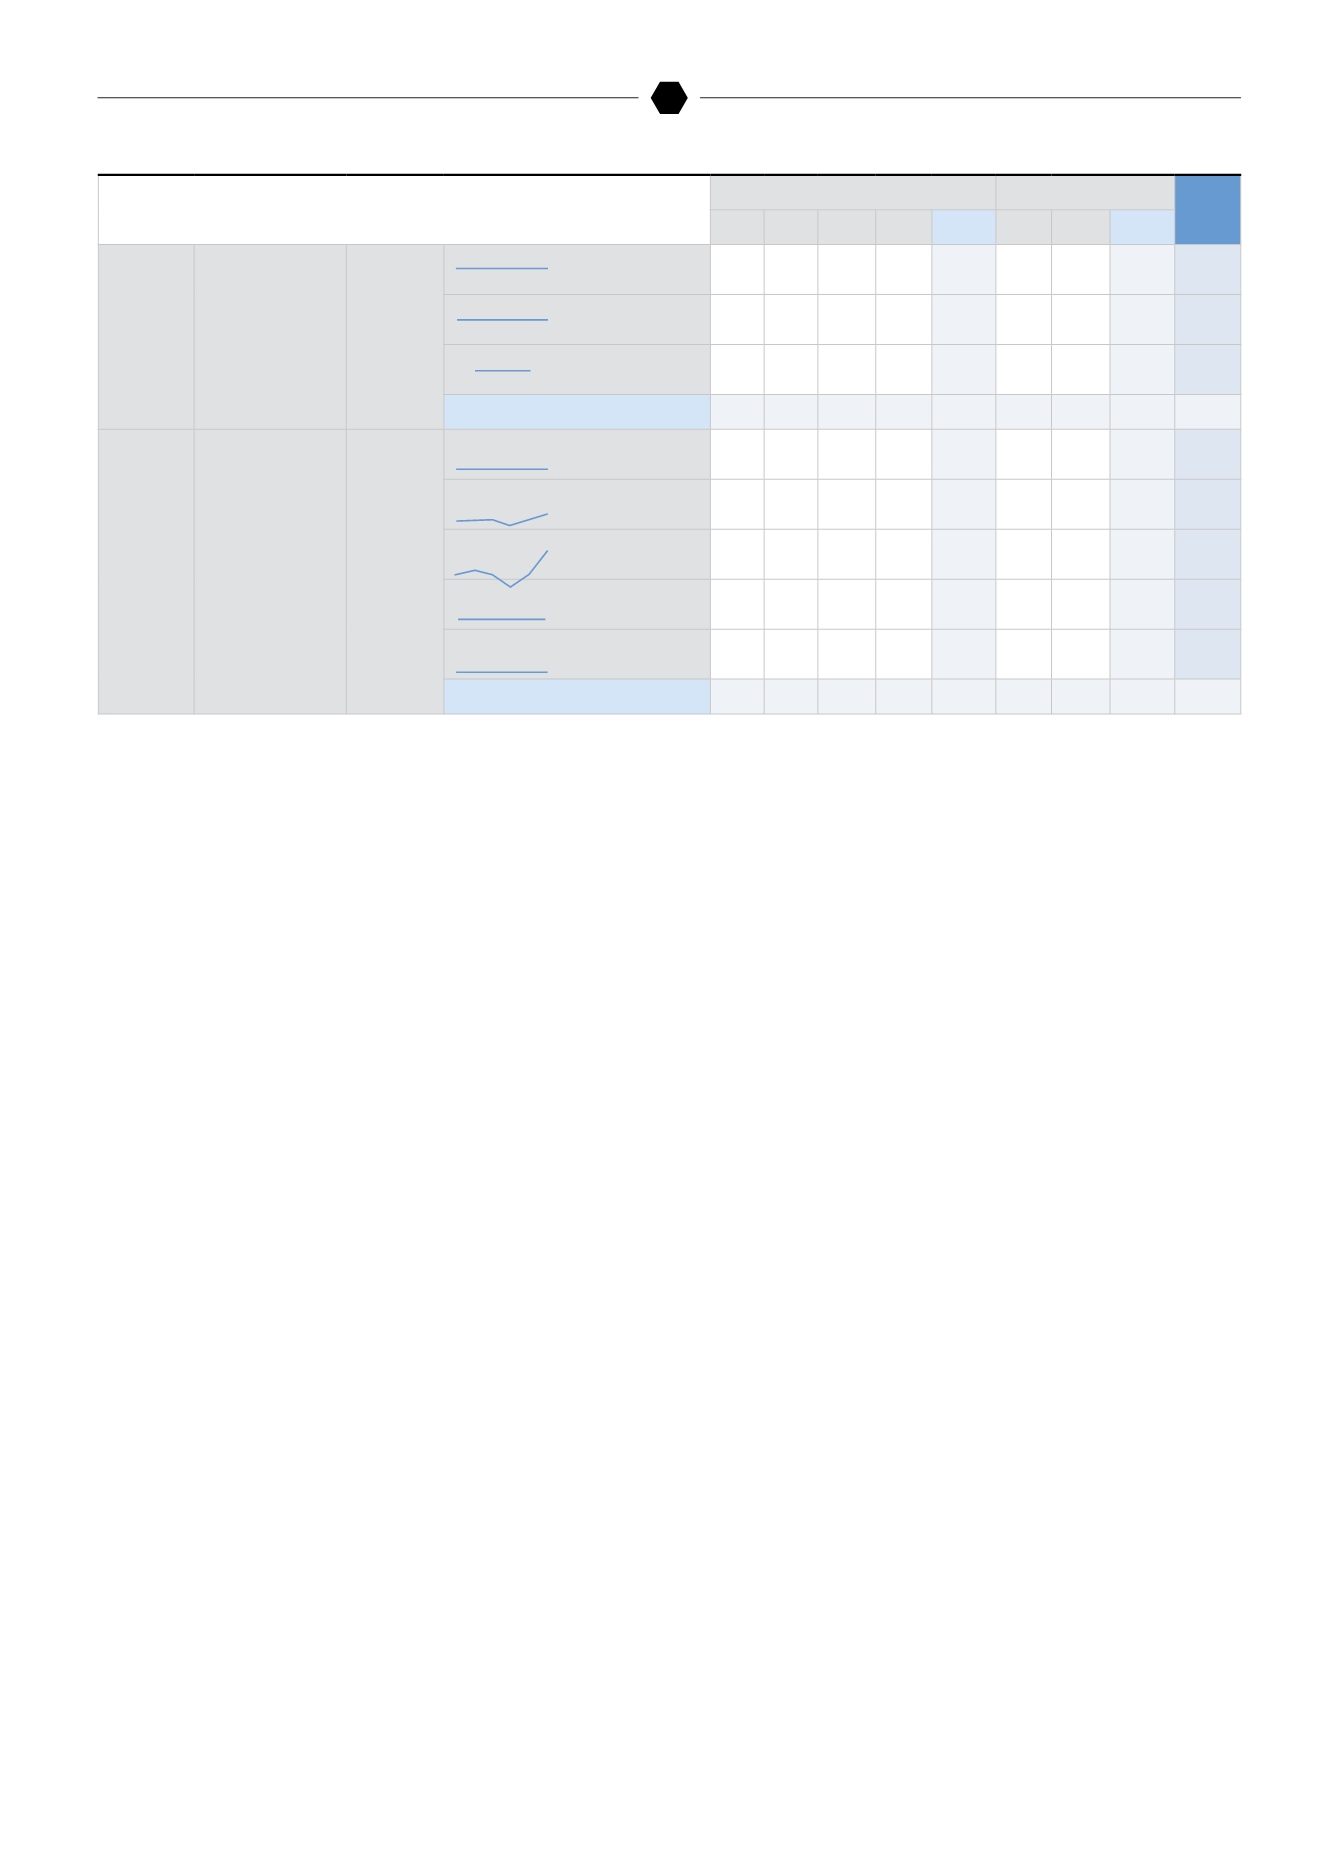
için İş Zekası Portalinde raporlar oluşturduk. Böylece hatalı
ve kalitesiz verilerin sayısının görülmesini, toplam kayıtlar
içerisindeki durumu ortaya koymaya çalıştık. Bu raporlarla
hatalı hasar veya poliçenin detayına kadar verilerin
incelenebilmesini sağladık.
(Şekil: 2-3)
Hazırlanan veri seti üzerinden yapılan bir başka çalışma
da Veri Kalitesi dashboardudur. Veri kalitesi resminin hem
özet hem de detay olarak görülebilmesini sağladığımız bu
ekran veri kalitesi danışma komitesinin alacağı kararlara
destek amacıyla tasarlandı. Burada düzeltilmesi gereken
verilerin toplam veri içerisindeki payı raporlanmakta kalite
çalışmaları için hangi noktalara odaklanılması gerektiği
ortaya konmaktadır.
(Şekil: 4-5)
Veri kalitesi sürecinin kurumların iş süreçlerini etkileyen
bir yönetim felsefesi olduğu bilgisinden yola çıkan SBM,
sigorta sektörünün en doğru verilerle en doğru kararları
verebilmesi için çalışmalarına devam etmektedir.
Following modeling, we started creating data sets for
data quality measurements by determining the Zones
and Problems in Liability Insurance and Comprehensive
Coverage products. For following up this work, we created
reports in Business Intelligence portal. This way, we tried to
make vi-sible, the number of incorrect and low-quality data
and to demonstrate the situation in records as a whole. With
these reports, we made it possible to investigate even the
details of incorrect claim or policy.
(Figure: 2-3)
Another project carried out in relation to the data set
prepared is the Data Quality dashboard. This screen, which
allows us to display data quality picture both in summary
and in detail, was designed to support the decisions to be
made by the data quality advisory board. Here, the share of
data that needs to be corrected in the total data is reported
and areas of focus to improve quality are shown.
(Figure:
4-5)
Moving from the fact that data quality process is a
management philosophy that influences the business
processes of organizations, SBM continues to work on new
projects with a view to enabling the insurance industry to
make the most accurate decision with the most accurate
data.
SBM’DEN
FROM SBM
2014
2015
TOPLAM
Eylül
Ekim Kasım Aralık
Toplam
Ocak
Şubat
Toplam
SİGORTA A.Ş.
Trafik Ürünü Veri Kalitesi
Şasi Problemi
Özel karakterli şasiler
20
23
11
11
65
6
7
13
78
I, O, Q harfleri olan şasiler
65
68
78
86
297
20
19
39
336
Türkçe karakter içeren şasiler
0
0
1
0
1
0
1
1
2
Toplam 159
157
128
142
586
39
42
81
667
SİGORTA A.Ş.
Trafik Ürünü Veri Kalitesi
Şasi Problemi
Türkçe karakter içeren şasiler
7
21
21
11
60
11
32
43
103
Özel karakterli şasiler
869 1,005
942
388
3,204 1,000 1,881
2,881
6,085
I, O, Q harfleri olan şasiler
3,273 3,845 3,248 1,485 11,851 3,507 6,534 10,041 21,892
17 karakterden farklı şasiler
16
8
2
3
29
1
0
1
30
Tekrarlanan şasiler
13
16
32
29
90
11
21
32
122
Toplam 4,178 4,895 4,245 1,916 15,234 4,530 8,468 12,998 28,232
Şekil-3: Veri kalitesi Raporu
Figure-3: Data quality report