


 36 / 76

36
Son 3 takvim yılı için tutanak adedi, araç adedi, araç kaza
yoğunluğu ve poliçe kaza yoğunluğu değerlerinin göste-
rildiği bir rapordur.
Haritadan il seçilimi yaptırılarak tüm
bu değerler il bazında kırılabilmektedir. İçinde bulunulan
yıl ve bir önceki yıl için ay bazında kıyaslama yapılabil-
mektedir.
Tutanak adedi değeri şirket, araç grubu, il/ilçe,
gün, saat, yaş grubu, cinsiyet kırılımlarında gösterilmekte-
dir. Kaza rakamlarının yazılan trafik poliçe adedi ile oran-
landığı poliçe kaza yoğunluğu, TÜİK’ten alınan araç adedi
ve buna bağlı araç kaza yoğunluğu araç grubu ve il bazında
kırılabilmektedir.
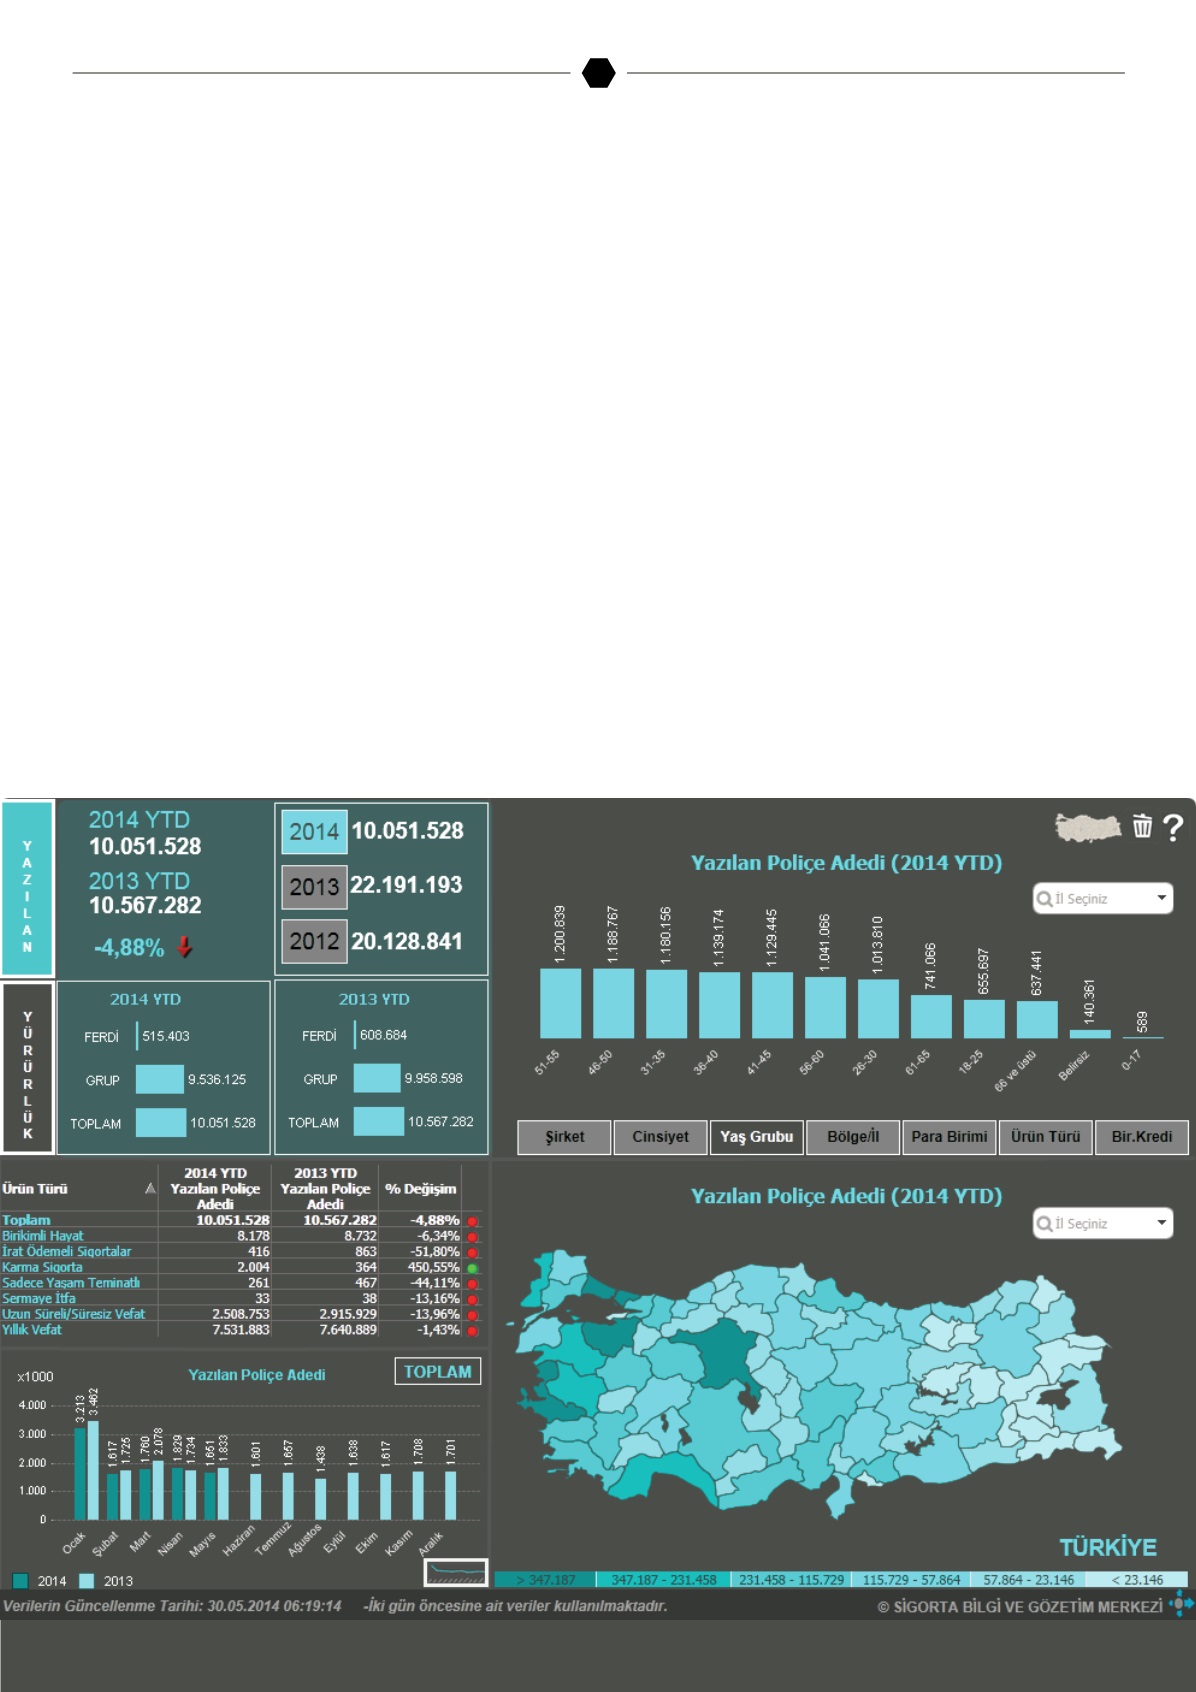
Hayat Sigortası:
Son 3 takvim yılı için yazılan ve yürürlükteki hayat poliçele-
rinin temel kırılımının, bu kırılımlar altında da şirket, cinsiyet,
yaş grubu, bölge/il, para birimi, ürün türü bazında kırılım-
ların olduğu bir rapordur.
Her bir temel kırılım altında bir
önceki yıl ile kıyaslama yapılıp, değişim oranı gösteril-
mektedir.
Ayrıca harita üzerinden il seçimi yapılarak o ile
ait yazılan ve yürürlükteki hayat poliçeleri verilmektedir.
İçinde bulunulan ve bir önceki yıla ait yazılan ve yürürlükteki
poliçeler ürün türü ve ay bazında kırılarak gösterilmektedir.
It is a report that summarizes the number of accident reports, num-
ber of vehicles, vehicle accident intensity and policy accident inten-
sity for the last 3 calendar years. The users can also view the results
for their city of choice by selecting a city from the map. The results
can be compared on a monthly basis within a certain year or among
different calendar years. The figure for the number of accident re-
ports is shown in the breakdowns of company, vehicle type, city/
district, day, hour, age group, and gender. Policy accident intensity
which is the ratio of number of accidents to the number of liability
insurance policies, the number of vehicles which is based on TUIK
data and vehicle accident intensity which is dependent on that can be
summarized in the breakdowns of vehicle type and city.
Life Insurance:
This is the report that summarizes, for the last 3 calendar years, the
inforce and written life insurance policies in the sub-breakdowns of
company, gender, age group, region/city, currency unit, and product
type. Under each main breakdown, the user can compare figures with
the previous year and view the amount of change between years.
Using the map, the user can also select a city to view the number of
written and inforce life insurances for that particular city. The written
and inforce policies for the inforce and previous year can be viewed
in the breakdowns of product type and month.